TaylorSwift1989
Senior Member
Lâu lâu mh đá qua task 1, biết là nó k quan trọng nhưng vẫn học. Mình gửi 1 bài mẫu nhờ mọi ng review, dạng này là dynamic graph tức là có sự biến thiên theo thời gian, thường mh k chia pie hay column hay bar hay các thứ, gộp vào dynamic hay static data
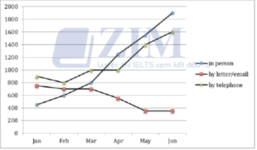
The given line graph illustrates how many requests were sent to the Tourist Information Office within 6 months from January 2011. While the number of requests sent by person and by telephone increased, with direct questions witnessing the most dramatic change being seen in the data, by letter/email saw a consistent reduction over the surveyed period.
In January, above 400 requests were sent by person, ranking the last (so sánh nhất) in terms of the number of requests, after increasing significantly to exactly 800 in the next two months. Following this rise, this figure soard up to above 1800 at the end of the period. Similar changes were recorded by people making calls(= by telephone), (the number of the requests by telephone) => they fluctuated from 800 to 1000 in the first four months before sky-rocket to 1600 in June
Conversely, a downward trend was displayed by letter and email, which declined marginally from approximately about 800 to 700 within two months from January. This figure then declined rapidly to 400 in May before (remaining unchanged in June) finally remained unchanged