kiến thức [Giáo Làng] Tư Vấn Tiếng Anh

Lesson 2: One Sided Answer or Two Sided Answer – Work or Study

[Part 2]


Do you work or study?
Do you work or are you a student?

Trong Lesson 1 mình mới phát triển được mỗi câu đầu. Dù đã nối dài một tí bằng cách mở rộng thông tin về trường, về bản thân nhưng tính ra vẫn là chưa đủ vì chả lẽ chỉ được mỗi một câu gọn lỏn.

Ví dụ với câu 1b2, mình chỉ có ý định họchọc.
1b2. I am a fourth year student who has an interest in English Teaching and plans to purse further education after graduation.
Giờ mình sẽ thêm 1-2 câu xoáy vào việc tại sao chỉ họckhông định đi làm. Các bạn lưu ý chỉ cần bám vào mấy chỗ xanh là được, tránh off-topic.
1b2a. I am not interested in having a temporary employment while at college since completing my full-time study quickly is a priority for me. Those work while studying would need an extra amount of time to obtain their degree, which could lead to rising costs of living and some other expenses.
Nửa vế cuối không biết có lan man không. Mình cố đưa thêm nhiều Structure vào để phần nói thêm đa dạng, còn về Vocabulary thì chưa có thêm được mấy từ khủng do mình theo đuổi phong cách viết của Simon, dùng từ đơn giản. Có lẽ mình cần phải đi sưu tầm thêm từ của Tây rồi quay lại cải tiến mấy ý này sau.

Với phương án 1b1, mình sẽ phát triển theo hướng đi làm sau khi tốt nghiệp. Viết nhẹ nhàng thôi để không quá lấn vào hướng work.
1b1. I am a fourth year student (of a Vietnamese university) who is about to take the degree of Bachelor of Science.

1b1a. After graduation, I am planning to find work in Applied Biology Science Careers, which has always been my… (*)
Ngành gì thì mình bốc phét tạm một ngành nếu tra theo cụm Bachelor of Science. Riêng chỗ (*) thì mình có mấy cụm nên đang phân vân, my… greatest source of enthusiasm/ goal/ field/ main passion.
 

Lesson 3: One Sided Answer or Two Sided Answer – Work or Study

[Part 3]


Do you work or study?
Do you work or are you a student?

Với hai phương án 1b1 và 1b2 trong Lesson 2, mình có hướng đi rõ ràng nên việc phát triển tiếp không khó. Tuy nhiên, nếu vòng về hai phương án đầu tiên dưới đây thì mình hoàn toàn có thể dừng lại ngay tại câu đầu vì ý (cần trả lời cho câu hỏi) của mỗi câu đều trọn vẹn.
1a1. I am a fourth year student in a prestigious university (which is) located in the North of this country.

1a2. I am currently studying at a branch campus (in Vietnam) of a prestigious British university.
Vậy câu hỏi đặt ra là khi mình trả lời được câu hỏi của giám khảo thì mình (nếu muốn) phát triển tiếp như thế nào để có thêm điểm (nhờ GrammarVocabulary xịn hơn) nhưng không quá lan man? Mình nghĩ đây là vấn đề về ý tưởng tiếng Việt.

Ví dụ với câu 1a1 mình sẽ thêm chuyên ngành vào (mình vẫn chưa nói gì về ngành học).
1a1a. I am majoring in Accounting and I am of the opinion that the accounting industry is always in-demand. It simply means that no matter the economic situation, people with an accounting degree can find stability in this industry.
Mình mở rộng một tí về triển vọng công việc sau này, nhưng vẫn bám vào ý study. Viết thêm về lý do chọn ngành học chắc không bị coi là off-topic nhỉ? Nếu có, theo mình là bỏ câu 3 đi là được.

Chuyển sang câu 1a2 một tí. Vì ở đây mình hướng vào việc học ở trường có yếu tố nước ngoài nên chắc hẳn mình phải đá sang vấn đề danh tiếng bằng cấp.
1a2a. Honestly speaking, my major is rather competitive, so acquiring internationally recognized qualifications is of great significance in later job hunting.
Cụm internationally recognized qualifications mình lấy trong bộ sách Complete IELTS mình hay dạy sinh viên trên trường. Câu này giống một luận điểm cho đề Reasons to Study aboard nên mình tận dụng luôn.

Một số cấu trúc mình lồng vào mình không bôi đậm để các thím chủ yếu tập trung vào phần phát triển ý thôi. Các thím cứ hình dung mình đang viết thì dễ hiểu hơn là nghĩ mình đang ôn nói. Nói thật ra cũng chính là viết ấy mà.
 

Lesson 3: Elderly Population

Teresa Huong Dang

[Chữa Viết] [Line Graph]


Đề:
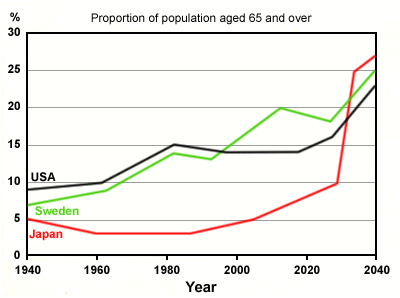
The graph below shows the proportion of the population aged 65 and over between 1940 and 2040 in three different countries.
xsample-ielts-task-1-line-graph-proportion-of-elderly-21638426.gif.pagespeed.ic.KFcmF6wxul

Gốc:
The line chart present the number of the old people of three countries from 1940 to2040. As an overall trend, it is clear that quantity of old people increased through years.

As can be seen clearly, there were a gradually rise of old-population in two countries : USA and Sweeden from 1940 to 1980. In contrast, it provided a slightly fall of old population in Japan.

The trend continue go up slowly for 2 countries : Japan and USA while it rocket for Sweden about 5%. At the end of the scale, it supply a speedily upward trend of over 64 years old people.

In brief, 3 countries have upsurged the amount of old population because of the improvement of medical and the birth-controlled method.

Sửa:
The line chart graph (1) present shows information about (2) the number of the old people the percentages of people aged 65 or over/ more/ higher (3) (4) (5) of in (6) three countries from 1940 to 2040. (7) As an overall trend, it is clear that quantity of old people increased through years. (8)
(1) Dùng đúng tên các dạng Task 1.
(2) Công thức thần thánh của mình luôn là,
shows information about. Mình lấy từ các đề đã thi đấy nên đừng bao giờ lo bị sai.
(3) Trong đề họ dùng
the proportion of thì mình phải đổi sang the percentages of nhé. Còn tí nữa ở Body thì có thể đưa về the figure(s) for.
(4) Trong tình huống khó nghĩ được cụm nào để thay thế thì nên giữ nguyên
aged 65 and và thay từ phía sau bằng higher/ more hoặc chuyển hẳn sang dùng 65 plus/ 65+.
(5) Nếu vẫn muốn thay thì mình gợi ý cụm
who were vì trên đề bài họ dùng Reduced Relative Clause và mình chỉ việc đưa về dạng đầy đủ là được.
(6) Giữ nguyên Preposition như ban đầu.
(7) Nếu Overview không có gì để nói thì có thể viết một câu, nhưng bài này chắc phải có tới hai câu đấy.
(8) Ngoài ra, nếu nói về
increase thì không thể dùng Past Simple do kéo dài tới năm 2040 lận. Mình gợi ý dùng Present Simple.

Overall, it is clear that the percentage of old people in all countries increase over the period of 100 years. Furthermore,… (9)
(9) Bạn tự tìm một thông tin nổi bật nữa nhé. Ví dụ dây của Nhật bị võng xuống một thời gian khá dài chả hạn.


As can be seen clearly, there were a gradually rise of old-population in two countries : USA and Sweeden from 1940 to 1980. In contrast, it provided a slightly fall of old population in Japan. (10) (11) (12)
(10) Bạn nên bắt đầu Body 1 bằng một con số, ví dụ:
Starting from… in… Mình lấy tạm USA đi.
(11) Sau đó mình nghĩ bạn nên so sánh với hai nước còn lại bằng cấu trúc
compared to...
(12) Bạn cần lôi Japan vào và nhấn mạnh vấn đề dây của nước này đi xuống cho tới quá năm 2000, tầm loanh quanh 5%.

The trend continue go up slowly for 2 countries : Japan and USA while it rocket for Sweden about 5%. At the end of the scale, it supply a speedily upward trend of over 64 years old people. (13)
(13) Đoạn này phải nói về giai đoạn Future với các kiểu câu như:
… is expected to…, … will be 65 years old or over.

In brief, 3 countries have upsurged the amount of old population because of the improvement of medical and the birth-controlled method. (14)
(14) Bên trên mình đã gợi ý Overview rồi nên chỗ này bỏ.

Nhận Xét:
1. Trong Overview, bạn cần lưu ý rằng từ increase phải chia ở Present Simple do toàn bộ giai đoạn mình cần miêu tả khá rộng, gồm Past, Present, và Future.

2. Bài của bạn mình gạch luôn cả Body. Gợi ý của mình cho Body 1 là chỉ miêu tả năm đầumấy năm sau. Còn Body 2 thì chỉ cần nói về năm cuối. Lưu ý là luôn phải so sánh giữa ba nước.

3. Bạn có thể bỏ qua giai đoạn giữa.
 

Lesson 4: Elderly Population

Hoa Sữa

[Chữa Viết] [Line Graph]


Đề:
The graph below shows the proportion of the population aged 65 and over between 1940 and 2040 in three different countries.
xsample-ielts-task-1-line-graph-proportion-of-elderly-21638426.gif.pagespeed.ic.KFcmF6wxul

Gốc:
The line graph compares the percentage of elderly people in three countries, USA, Sweden and Japan.

Overall, the percentage of the old grows between 1940 and 2030 in these three countries.

In 1940, the proportion of citizens living at the age of 65 and over in USA was under 10%. The figures for Sweden and Japan were lower, at about 7% and 5% respectively. During the next 40 years, there was an upward trend similarly in both USA and Sweden, while the figure for Japan declined gradually.

However, by 2040, the percentage of the old is highest in Japan. Almost 27% of Japan living at the aged of 65 and over, compared to about 25% of Sweden and only 22% of USA.

Sửa:
The line graph compares the percentages (1) of elderly people in three countries, USA, Sweden and Japan (2) over a 100-year period (3).
(1) Mình có để ý vụ này. Theo mình thường sẽ là the proportion = the percentages.
(2) Em bỏ liệt kê nước đi vì chả cần thiết phải làm vậy.
(3) Thay vào đó, em nên chú ý yếu tố năm. Đề có cho mà mình lại bỏ qua là bị trừ điểm nặng.


Overall, the percentage of the old population/ people/ citizens (4) grows between 1940 and 2030 in these three all countries (5). (6)
(4) Chỗ này phải là Adj + N.
(5)
in all countries mới đúng.
(6) Nếu chỉ có một câu Overview thì em nên nối vào Introduction phía trên.


In 1940, the proportion of citizens living at the age of people who were aged (7) 65 and over in the USA was under 10%. The figures for Sweden and Japan were lower, at about 7% and 5% respectively. During the next 40 years, there was an upward trend (8) similarly (9) in both USA and Sweden countries (10), while the figure for Japan (11) declined gradually (12).
(7) Chỗ này không nên bị mất điểm. Cụm từ quan trọng của đề cần phải được chuẩn bị các phương án thay thế thật kỹ lưỡng.
(8) Thường thì cụm này họ dùng cho Overview còn trong Body thì miêu tả như trong ghi chú (9) dưới đây này.
(9) Mình không nghĩ nên diễn đạt như thế này. Nói đơn giản thôi,
the figures for … and … both reached…
(10) Mình có sửa lại lỗi sai cho phương án (cũ) của em. Tuy nhiên, góp ý một tí là cách viết này không có số liệu đi kèm nên sẽ không ăn điểm.
(11) Em đã dùng từ này trước đó rồi nên có lẽ thay bằng
Japan’s figure hoặc dùng kiểu Japan saw…
(12) Luôn phải có số liệu.

However, (13) by 2040, the percentage of the old/ aging people/ elderly residents (14) is will be (15) (16) highest in Japan (17). (18) Almost 27% of Japanese people were living at the aged of 65 and over, (19) compared to about 25% of Sweden and only 22% of USA (20).
(13) Không viết như thế này trong Task 1.
(14) Có vẻ em chưa chuẩn bị tốt các từ thay thế.
(15) Body 2 phải là về Future Tense.
(16) Có thể dùng
is expected to be.
(17) Yếu tố nước phải được đưa lên đầu câu, ví dụ:
the figure for Japan will be highest among the three countries.
(18) Có thể dùng thời gian để nối với câu trước. Ví dụ:
After 100 years/ At the end of the period shown…
(19) Nếu em định dùng while/ whereas thì có thể viết như sau: …, while the figures for … will be about…
(20) Chỗ này làm mình phân vân mãi. Theo mình of nên chuyển thành in thì hợp lý hơn.

Nhận Xét:
1. Những đề kiểu như thế này rất dễ bị lặp từ, chủ đạo sẽ là dân số già.

2. Cái khó tiếp theo là em phải dùng từ uyển chuyển từ tên nước cho đến số liệu.

3. Cảm giác một số xu hướng, đặc điểm chính chưa được em đề cập, ví dụ như a sudden jump of x% của Japan hay phần fluctuations của nước này cũng chưa được nói đến.
 
Last edited:

Lesson 5: Share Prices

bongbonnie

[Chữa Viết] [Line Graph]


Đề:
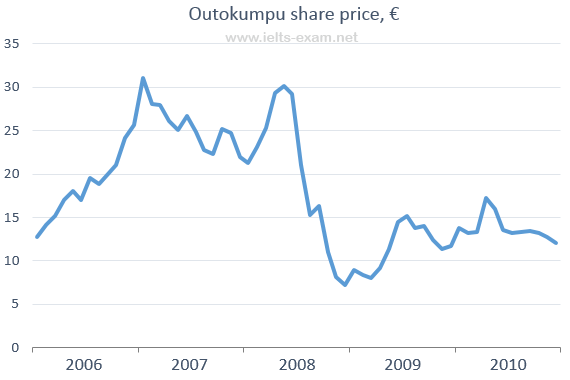
The line graph below shows the changes in the share price of Outokumpu companies in euros between January 2006 and December 2010.
IELTS_Writing_Task_1_156

Gốc:
A glance at the graph provided reveals the share price of Outokumpu change in a five-year during the period from January 2006 to December 2010.

It is noticeable that the share price rate fluctuated over the period shown. The figures for the share price peaked in 2007 and 2008, but it witnessed the lowest point by the end of 2008.

In 2006, the share price was at EUR 13 per share, there was a sudden increase around EUR 21, after reaching a peak of EUR 31 in the last year. This higher period, however, did not last long, and it decrease before rising significantly in 2008. From mid-2008, the figures of the share price fell considerably through the end of the year and the lowest point in this period was at just over EUR 7 per share. After that the share price rose by nearly EUR 10 in early 2010. Until late 2010 the trend was downward again, end of the year at just over EUR 12.

Sửa:
A glance at the graph provided reveals gives information on (1) the share price of Outokumpu change (2) in over a five-year during the (3) period from January 2006 to December 2010.
(1) Mình hạn chế dùng các từ lạ, cứ shows/ gives information/ data about/ on là được rồi.
(2) Nếu bạn muốn dùng từ này thì nên viết là
compares trends/ changes in…
(3) Simon hay viết over a period of x years between x and y.

It is noticeable that the share price rate of … (4) fluctuated over the period shown. (5) The figures for the share price peaked in 2007 and 2008, but it witnessed the lowest point by the end of 2008.
(4) Cần chuẩn bị một số phương án thay thế cho the share price of Outokumpu companies.
(5) Bạn viết dài quá! Đề này chỉ cần mỗi câu đầu thôi. Ví dụ của mình:
It is noticeable that there were considerable fluctuations in the share price of these companies over the five-year period.

In 2006, the share price (6) was stood (7) at EUR 13 per share, (8) there was a sudden increase around EUR 21, after reaching (9) a peak of EUR 31 in the last year (10) (11) (12). This higher period, however, did not last long (13), and it (14) decreased before rising significantly in 2008.
(6) Nên viết đầy đủ như đề bài.
(7) Mình có hai phương án. Một là
… was EUR 13 per share. Hai là … stood at EUR 13 per share.
(8) Chỗ này bạn có thể viết
this figure để nối với vế trước.
(9) Để dùng
after/ before thì phải cùng Subject.
(10) Cụm này là dành cho Present Perfect.
(11) Nguyên câu này là một đóng tạp phế lù bạn nhồi vào. Cần tách ra làm từng ý nhỏ (có thể là câu ghép, câu đơn).
(12) Đầu giai đoạn thì bạn nên viết thế này:
Starting from 13 EUR per share in 2006, the share price of … fluctuated…
(13) Thay vì nói thế này thì nên chỉ cần bảo tăng hoặc giảm trong bao lâu…
(14) Subject của vế trước có phải là
the number đâu mà bạn thay bằng it.

(15)
From mid-2008, the figures of the share price of … fell considerably through to the end of the year given period and the lowest point in this period was at just over EUR 7 per share (16) (17). After that, the share price of … rose by nearly EUR 10 in early 2010. Until late 2010, the trend was downward again (18), end of the year (19) at just over EUR 12.
(15) Mình tách đôi Body của bạn ở chỗ này.
(16) Bạn toàn nhồi nhiều ý vào một câu.
(17) Bạn nên học cách viết câu phức ví dụ:
Mid-2008 witnessed a second highest hit, followed by a steep fall to the lowest point of 7 EUR…
(18) Giống văn nói hơn là Task 1.
(19) Chỗ này hơi khó hiểu. Thường thì thời gian mình để cuối.

Nhận Xét:
1. Với Overview chỉ có một câu duy nhất thì phải nối vào câu Introduction thành một đoạn. Theo mình thấy thì biểu đồ trên khá đơn giản, nên khó mà viết tận hai câu.

2. Lần sau khi bạn tham khảo bài của người khác chỉ nên nắm các điểm nổi bật cần nhắc đến rồi tự viết chứ không nên viết lại từng câu của bài mẫu. Điều quan trọng hơn cả là mình có thể nhìn ra được các xu hướng chính.
 
Last edited:

Lesson 23: Population Growth

congatrong11o

[Chữa Viết] [Line Graph]


Đề:
The line graph shows the percentage of New Zealand population from 1950 to 2050.

Gốc:
A glance at the provided line graph reveals the proportion of people which varies according to age group in New Zealand from 1950 to the present day and predictions to the year 2050.

Overall, while the percentage of children under 14 years old and that of people falling into the 25 to 37 age group enjoyed upward trends, the opposite was seen in the other groups. In addition, it can be observed that New Zealand has had an aged population, with the majority of those aged 65 and older.

More specifically, the percentage of people aged from 38 to 45 underwent a dramatic upswing from somewhere in the vicinity of 35 percent in 1950 before reaching its peak of nearly a half in 1990, while that of the elderly group evidenced a more slightly rise from roughly 60 percent to its highest point of 70 percent. The figures then were reported to decline and are anticipated to continue these trends to shy of approximately 40 percent for the former and to 55 percent for the latter in 2050.

Having the same trend, the proportion of the next younger group witnessed a downturn but earlier, since 1960, with a marked projection to account for less than one percent of total citizens in the future. Meanwhile, albeit being the minority of New Zealand residents during sixty years, the number of youngsters is estimated to rise substantially to reach a fifth of this country’s population, surpassing the 25-37 class.

Sửa:
A glance at the provided line graph reveals gives information on (1) the proportion of (2) (3) people (4) which varies according to age group (5) in New Zealand (4) from 1950 to the present day and predictions to the year 2050 (6).
(1) Mấy chỗ này hơi tiểu tiết. Theo mình nên viết đơn giản nhất có thể.
(2) Có mấy đề người ta ghi
the proportion thì mình sửa thành the percentages vì trong hình vẽ có nhiều nhóm đối tượng. Tuy nhiên, với đề này thì ngay từ đầu họ đã ghi sẵn the percentage thì mình nên hiểu như thế nào? Bạn xem thử nguồn này. Trong hình có bốn dây nên mình hướng về phương án the percentages.
(3) Sửa thì mình chỉ có một giải pháp là
the proportion.
(4) Mình phân vân tại sao bạn không dùng luôn cụm
the population growth của hình vẽ.
(5) Mình viết đơn giản hơn bạn,
by age. Cũng có thể viết of the four (different) age groups.
(6) Về thời gian, bạn không nên thêm thắt lung tung. Đề cho sao mình paraphrase lại theo chừng mực của đề. Ví dụ như thế này:
over a period of x years between x and y.
(*) Vì bạn mắc nhiều lỗi nhỏ ở Introduction nên mình có viết thêm một chút ở phần thứ ba của bài viết này, bên cạnh các ghi chú từ (1) đến (6).


Overall, while the percentage of children under 14 years old and that of/ the figure for people falling into the 25 to 37 age group (7) enjoyed upward trends (8), the an opposite (9) was seen in the figures for the other groups (10). In addition, it can be observed that New Zealand has had an aged population, with the majority of those aged 65 and older. (11)
(7) Mình gợi ý một phương án đơn giản:
those aged 25 to 37.
(8) Không ai nói như thế này. Sao bạn không miểu tả đơn thuần lên hoặc xuống đơn giản thôi?
The figure for … reduced over the given period.
(9) Bạn phải nói rõ ra là an obvious trend.
(10) Không nên nói tắt vì Subject của vế đầu rõ ràng.
(11) Chỉ cần một câu thôi và đẩy câu Overview lên cùng đoạn với câu Introduction. Nên viết dài Body.


More specifically, the percentage of people aged from 38 to 45 underwent a dramatic upswing from somewhere in the vicinity of 35 25 percent in 1950, before reaching its peak of nearly a half of the … in 1990, while that of the elderly group evidenced a more slightly rise from roughly 60 percent to its highest point, of at 70 percent. The figures (12) then were reported to decline and are anticipated to continue these trends to shy of approximately 40 percent for the former and to 55 percent for the latter in 2050. (13)
(12) Nên tách ra vì bọn này còn biến đổi nhiều lắm!
(13) Theo mình thì nên chia làm hai giai đoạn thay vì chia theo hai dây. Và nếu bạn đi theo hướng này thì chỉ cần miêu tả số liệunăm cuối. Simon có rất nhiều bài viết mà Body 2 chỉ miêu tả số liệu đơn thuần.


Having the same trend, the proportion of the next younger group (14) witnessed a downturn but earlier, since 1960, (15) with a marked projection to account for less than one percent of total citizens in the future (16). Meanwhile, albeit being the minority of New Zealand residents during over the first sixty years (17), the number of youngsters (18) is estimated to rise substantially to reach (19) a fifth of this country’s population, surpassing the 25-37 class.
(14) Mình không đồng ý phương án này lắm! Mình gợi ý hai cụm thay thế là: the figure for 25- to 37-year-olds that of the 25 to 37 age group.
(15) Quá khó hiểu.
(16) Bạn nên có số liệu rõ ràng.
(17) Cứ viết đơn thuần
between … and … cho nhanh.
(18) Chưa rõ ràng.
(19) Nếu bạn tách câu thì mình nghĩ viết như thế này hợp lý hơn:
the proportion of … is estimated to…, reaching/ with its figure reaching… Câu cuối hơi loằng ngoằng, kiểu ôm đồm nhiều ý tưởng.

Nhận Xét:
1. Introduction em viết không ổn. Tốn thời gian vào những chỗ không cần thiết.

2. The line graph shows information about là quá đủ. Không cần bất kỳ cụm nào cầu kỳ.

3. Về vấn đề paraphrase cụm chính của đề thì cách đầu tiên sẽ là tận dụng cụm từ population growth của hình vẽ. Cách tiếp theo là thay cụm the percentage of New Zealand population, thành the proportion of the population in New Zealand hoặc the proportion of New Zealand’s population.

4. Trong hình có bốn nhóm tuổi mà bạn chưa cho by age group hay in/ of/ from four age categories vào.

5. Trong đề chỉ có from 1950 to 2050 nên chỉ cần quan tâm đến cả giai đoạn. Vì vậy chỉ cần over a period of 100 years between 1950 and 2050 là xong.
 

Lesson 24: Phone Services

Mailan94

[Chữa Viết] [Line Graph]


Đề:
The graph below shows US consumers’ average annual expenditures on cell phone and residential phone services between 2001 and 2010.

Gốc:
The line graphs illustrates the average yearly spending on the moblie phone and landline phone services from 2001 to 2010 in the United State.

It is clear that the average annual expenditure on the cell phone services experienced an upward trend, whereas the figure for residential phone services saw a significant decrease over the period of 9 years starting in 2001. The year 2006 marked a point at which the average annual spending on mobile phone services overtook that of landline phone services.

In 2001, US consumers spent approximately $700 on residential phone services (dropped by nearly $200) in comparison with nearly $200 on mobile phone services (rose by approximately $300). In the year 2006, the average Americans paid on cell phone services and landline phone services were the same, at over $500 on each.

By 2010, the expenditure on mobile phone services reached to $750, while the figure for residential phone services continued witnessing a downward trend, reduced to over $400.

Sửa:
The line graphs illustrates (1) the average yearly spending on (2) the (3) moblie phone and landline phone services from 2001 to 2010 in the United State (4).
(1) Như thế này không hiểu là mấy hình, mấy biểu đồ?
(2) Bạn viết
average yearly spending on đúng nhưng the thì thừa.
(3) Xem kỹ lại phần Article trong sách.
(4) Yếu tố thời gian luôn được đưa vào cuối câu. Còn cụm
in the United State cần được paraphrase tốt hơn (tham khảo ghi chú dưới cùng của bài này).

It is clear that the (5) average annual expenditure on the cell phone services experienced an upward trend, whereas the figure for residential phone services saw a significant decrease over the period of 9 years starting in 2001. The year 2006 marked a point at which the average annual spending on mobile phone services overtook that of landline phone services. (6)
(5) Có nhiều bài mẫu của Simon không dùng
the. Theo mình thì bạn nên bỏ.
(6) Dài quá! Trong khi Body 1Body 2 bên dưới lại không được mấy câu.


In 2001, US consumers spent approximately $700 on residential phone services (dropped by nearly $200) (7) in comparison with nearly $200 on of mobile phone services (rose by approximately $300) (8). In the year 2006, the average Americans (9) paid (10) on cell phone services and landline phone services were the same, at over $500 on each. (11)
(7) (8) Tự dưng bạn mở ngoặc thế này làm mình thấy rất khó hiểu. Rõ ràng là bạn đang hướng vào năm khởi đầu mà nhỉ?
(9) Bạn cần làm rõ định nghĩ của từ
average. Ở đây theo mình cụm từ đúng phải là: an average American. Bạn cũng có thể sử dụng cụm on average như một Adverb.
(10) Sai cấu trúc.
(11) Nguyên câu này phải viết lại. Một là:
An average American consumer paid … on both services. Hai là: The amount of money spent by … on both services was similar,… Phía sau thì bạn viết ổn rồi, nhưng bạn bị lẫn lộn giữa hai cấu trúc mình dùng ở đây.

By 2010, the expenditure on mobile phone services reached to $750, while the figure for residential phone services continued witnessing a downward trend (12), reduced (13) to over $400 (14).
(12) Body không miêu tả như thế này được. Bạn cứ viết như câu trước nhưng đổi kiểu đi. Nếu bạn vẫn muốn dùng từ trend thì phải sửa là followed an upward trend hoặc there was an upward trend. Ngoài ra, nếu muốn đi theo hướng see/ witness/ observe thì cần lưu ý Subject phải là người, nước, hay công ty. Ở đây bạn nên viết là an opposite trend was witnessed.
(13) Mình gợi ý bạn viết như sau để tận dụng từ
reached: The figure for …, reducing to…
(14) Cần phải có yếu tố thời gian vì bạn có con số của năm cuối cùng.

Nhận Xét:
1. Xem lại phần lý thuyết về Article.

2. Đây không phải là vấn đề tại Mỹ mà là do người Mỹ, US customers, và bạn phải paraphrase lại cụm này chứ không được sửa là in the USA. Hợp lý nhất là dùng Passive Voice kiểu by US people, by Americans, v.v.

3. Overview của bạn rất dài trong khi Body 2 thì có mỗi một câu ngắn. Khi viết trong 20′ bạn chỉ nên dành 5′ cho hai đoạn đầu thôi, dồn sức cho Body. Đừng cố viết Overview thật hoành tráng.

4. Có hai cách để đề cập đến đối tượng trong bài là spending on … phonesexpenditure on … services.
 

Lesson 25: Population Growth

Yentrexx

[Chữa Viết] [Line Graph]


Đề:
The line graph shows the percentage of New Zealand population from 1950 to 2050.

Gốc:
The given line chart compares the ratio of population in 4 age groups in New Zealand over a period of one century.

From the overall perspective, most of the age brackets witnessed a downtrend, except for people from 0 to 14. It also can be seen that the over-65-year-olds was by far the highest number in this country.

Looking at the chart in more detail, people aged 0 to 14 remained stable at the lowest proportion from 1950 to 1995 with approximately 5%, but later rose dramatically until 2050. However, after increasing slightly in the early years by 5%, the number of the citizen who belonged to the 25 to 37 age group saw a tremendous decrease and was expected to make up the smallest number around 2% in the last year.

The figure for both people who fail into the 38 to 45 and over 65 age group grew up during the period between 1950 and 1990 then dropped gradually afterward and will hit the rock-bottom at nearly 40% and 55% respectively at the end of period shown.

Sửa:
The given line chart compares the ratio of population in 4 age groups (1) in New Zealand over a period of one century 100 years (2).
(1) Mình có góp ý về Introduction bên dưới.
(2) Chưa thấy ai viết như bạn. Theo mình thì chỉ nên đưa số năm vào là được rồi.


From the overall perspective, (3) most of the age brackets witnessed a downtrend, except for people from 0 to 14 (4) (5). It also can be seen that the over-65-year-olds was by far the highest number in this country.
(3) Đây như kiểu giọng văn Task 2?
(4) Mình nghĩ bạn đã nhận định sai vì xét điểm đầuđiểm cuối thì có hai nhóm lên, hai nhóm xuống cơ.
(5) Ngoài ra, về cách diễn đạt thì mình sẽ miêu tả như thế này:
the proportions of … increase. Mình dùng thời Present Simple trong câu này vì giai đoạn chúng ta đang xét kéo dài tới tận Future Years.

Looking at the chart in more detail, (6) people aged 0 to 14 remained stable at the lowest proportion (7a) from 1950 to 1995 with approximately 5% (7b), but later rose dramatically until 2050 (8). However, after increasing slightly in the early years by 5%, the number proportion of the citizens (9) who belonged to the 25 to 37 age group saw a tremendous decrease and was (10) expected to make up the smallest number around 2% in the last year (11).
(6) Phải thêm cụm the proportions of vào nữa mới đúng.
(7a) (7b) Bạn chỉ nên chọn một cách diễn đạt số liệu, nhưng theo mình là
at.
(8) Theo như ý này thì bạn chia hai dây một đoạn. Mình nghĩ nên chia hai giai đoạn. Với cả, nếu cứ theo cách chia của bạn thì ý này bạn không cho con số nào vào nhỉ? Tối thiểu cũng là số liệu của năm cuối cùng.
(9) Thiếu gì cách diễn đạt. Bạn dùng Past Simple ý là mấy người này chết rồi?
(10) Bạn đang dùng cấu trúc dự đoán mà lại để thời Past Simple. Thật sự mâu thuẫn.
(11) Đây là Line Graph nên chỉ có tănggiảm. Còn bạn muốn miêu tả kiểu chiếm bao nhiêu phần trăm thì nên nói về số liệu năm cuối. Lúc này thì phải xem lại cách chia ý cho Body. Mà mình có cảm giác là bạn không biết tại sao phải chia như mình nói nhỉ? Bạn bỏ qua giai đoạn tương lai rất vô tư.


The figures for both people who fail into the 38 to 45 age group and over 65 age group the elders grew up during the period between 1950 and 1990, then dropped gradually afterwards and will hit the rock-bottom at nearly 40% and 55% respectively at the end of period shown. (12)
(12) Viết thế này là lỗi đấy, chứ không phải ăn điểm Grammar đâu.

Nhận Xét:
1. Bạn chú ý đăng bài đủ đề để người khác còn nhận xét bạn viết sai hay đúng. Mình xin góp ý một chút về việc viết Introduction cho đề này.

2. Đầu tiên, bạn cần xác định các từ, cụm từ phải paraphrase, line graph (1), show (2), percentage (3), New Zealand population (4), và from 1950 to 2050 (5). Bạn đã xử lý được (1) và (5) còn (4) bạn có tách ra nhưng ghép với ratio thì chưa được nên (4) coi như chưa paraphrase.

3. (1) không cần sửa còn (3) thì chỉ cần đổi thành proportion là xong. Đừng thay tùm lum theo kiểu rate, level, và ratio chưa chắc đã đúng mà sẽ tốn thời gian chọn từ.

4. Riêng số (2) thì lưu ý là show thêm information about là quá ổn. Còn nếu dùng compare bạn phải tìm được nhóm đối tượng nào có thể bị đem ra so sánh, ví dụ so sánh ba nước, so sánh ba thành phố, so sánh ba nhóm tuổi, v.v. Như vậy thì cách bạn dùng compare ở đây đã đúng chưa? Mình sẽ không mạo hiểm chọn từ này với đối tượng là các nhóm tuổi.

5. Introduction phải thêm vào được yếu tố nhóm tuổi vì hình có đề cập. Theo mình thì in four age categoriesby age (group) dễ thay nhất.

6. Mình còn một cách nữa là vẫn sử dụng các từ, cụm từ bên trên nhưng tận dụng hình, show information about the population growth of four different age groups in New Zealand. Cách này xem ra đơn giản hơn.
 

News 21: Pompeo to Deliver Speech in Georgia Less Than a Month before State’s Runoff Senate Elections


Link
Pompeo defended the speech as an important foreign policy address and took a shot at his predecessors in an interview on “The Guy Benson Show” Monday.

Cụm defend the speech /dɪˈfend/ (v) /spiːtʃ/ (n) làm mình phân vân nên mình quyết định chọn câu này dù hơi ngắn. Thường mình hiểu từ defend này là protect /prəˈtekt/ (v) và có thể đi với against /əˈɡenst/ (prep) với nghĩa bảo vệ bản thân, bảo vệ thân chủ (biện hộ), v.v. hoặc phòng thủ (trong thể thao).
Vấn đề khó ở đây là ông này đang bảo vệ (tạm dịch) một bài thuyết trình, một bài nói chuyện, v.v. Nhưng mình tra mãi mà vẫn chỉ thấy mỗi nghĩa này. Mình sẽ quay lại sửa sau nếu nghĩ ra cách dịch nào hay hơn mặc dù có vẻ là không có nghĩa nào khác ngoài nghĩa như trên.
Với từ sau, có nghĩa a formal talk rất đáng lưu ý. Có vài ghi chú như give/ make/ deliver a speech.

foreign policy address /ˈfɒr.ən/ (a) /ˈpɒl.ə.si/ (n) /əˈdres/ (n) hơi dài nên mình sẽ tách ra.
Trước hết address thường được hiểu đơn giản là home details. Nhưng cũng có thể hiểu là a formal speech. Tức là hai từ này gần giống nhau và vì vậy trong câu mình trích dẫn có thể hiểu là tác giả đang lôi Synonym vào. Quan điểm này giúp lý giải chữ as trong câu trên cùng.
foreign policy hiểu là chính sách nước ngoài thôi nhỉ? Hay chính sách đối ngoại? Vậy cả cụm sẽ là: một bài phát biểu về chính sách đối ngoại?

take a shot at /ʃɑt/ (n) không đơn giản vì mình tra từ shot có mỗi nghĩa attempt /əˈtempt/ (n) là có vẻ ổn. Ông này đang thử/ cố gắng làm gì? Hỏi mà chưa có câu trả lời nên mình đoán cách tiếp cận của mình chưa ổn. Và thử theo hướng Idiom thì có từ điển dịch là chỉ trích. Nghe cũng hợp lý.

predecessors /ˈpriː.dɪˌses.ər/ (n) là những người tiền nhiệm.

in an interview on /ˈɪn.tə.vjuː/ (n) thì dễ rồi. Chỉ cần nhớ hai Preposition đi kèm là được. Tuy nhiên, mình phân vân là on này đi với tên chương trình TV hay đi với thời gian hay cả hai? Nếu là thời gian sao họ không dùng this Monday?
 
1626118728847.png
1626118732365.png
1626118735472.png
1626118738637.png
 
Bác Trung ơi bác có suy nghĩ gì về mấy bài mẫu IELTS Writing của các thầy cô NN nổi tiếng như Simon và Liz ạ, hồi trước em đọc nó để đi thi IELTS, giờ đg coi lại chiến thuật mong bác giúp ạ
 
Bác Trung ơi bác có suy nghĩ gì về mấy bài mẫu IELTS Writing của các thầy cô NN nổi tiếng như Simon và Liz ạ, hồi trước em đọc nó để đi thi IELTS, giờ đg coi lại chiến thuật mong bác giúp ạ
Hội đấy cho bài free mà lại là Tây thì cứ thế dùng thôi. Điểm dở là phong cách của họ có thể biến tấu một chút chứ ko cố định. Như của mình thì thành khuôn luôn và áp dụng cho đa số các bài. Phải tự chắt lọc ra.
 
Hội đấy cho bài free mà lại là Tây thì cứ thế dùng thôi. Điểm dở là phong cách của họ có thể biến tấu một chút chứ ko cố định. Như của mình thì thành khuôn luôn và áp dụng cho đa số các bài. Phải tự chắt lọc ra.

Bác có thể cho mình một cái khuôn để ví dụ đc ko ạ?
 
Thím thớt cho lợn hỏi, cái giáo trình này dành cho người có trình độ từ mức nào trở lên vậy. Lợn mù chữ thì có thớt nào dạy từ đầu không nhỉ?
 
Back
Top